|
|
|
|
|
|
||
| Sweep, Parameter sweeping In this analysis, (actual Sweep.scp file), you need to identify the parameters you want to sweep symbolically, for example R1Vary, using the Tolerance/Sweep/Optimize tab for the appropriate part properties. Enter the sweep variable name under the Sweep column on the same row of the parameter you want to sweep. You can use the same sweep variable for multiple parameters. For example if you enter the same sweep variable name for multiple resistors value then they will be swept as a group. You can disable a sweep variable by clicking under disable column across from the sweep variable you want to turn off. You can sweep 2 sweep variables during simulation, one for outer loop and the other for an inner loop. This works like the DC sweeps built into IsSpice, except with the sweep template you are not limited to a DC analysis.
|
 |
|
|
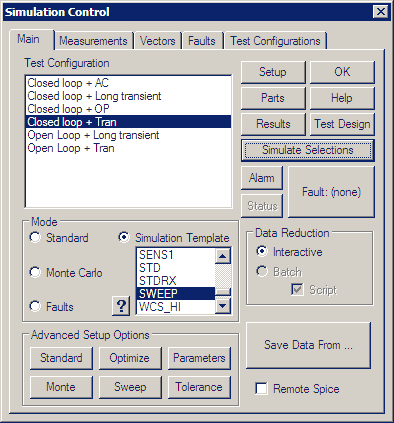
Then make
sure the Sweep Simulation Template is selected, and the radio button above
the question mark is selected. Then Select one of the appropriate Test
Configurations and press Simulate Selections button. Progress will be
shown in the IsSpice output window.
|
|
After the simulation has finished, you can use Scope5 to view the data. The Sweep button will be shown in the Add Waveforms dialog. A plot called sweep was made to hold the sweep results. If you didn't make measurements before running the sweep template, you can use the sweep dialog to add results to the sweep plot. You can plot data from the sweep plot using either the Add Waveforms dialog or the Sweep dialog. Three special vectors were created; sweepdef (default), ramp and outer. Sweepdef is a sawtooth plot, which is the inner vector that repeats for each outer point. Outer is a staircase that steps up for each inner point. Ramp is a vector that goes from 0 to the product of (inner * outer - 1) points. Plotting a parameter versus ramp and then plotting the family, for example outer vs. inner, you can check the link box in the scaling dialog and drag cursor 1 along the plot with ramp in the x-axis and view the parametric value in the outer vs. default (inner) plot. |